Add Custom Data
Location: Add Custom Data
Although the COVID Atlas includes up to date information on county-level COVID vaccinations, tests, hospitalization, and case rates, you might be looking to visualize datasets that are not yet incorporated into the Atlas – whether that be a different variable or unit.
To load and visualize your own geospatial data in the context of the U.S. COVID Atlas, first ensure that your data is in the GeoJSON data format. GeoJSON is a spatial data format that allows you to place data in a particular location on a map.
If the data you are looking to visualize is tabular (or it ends in .xls, .csv, or .tsv), you can easily transform it to the spatial format GeoJSON file using GeoJay.
How to use GeoJay:
- Navigate to GeoJay at geojay.netlify.app; GeoJay easily identifies and joins tabular data into the geospatial administrative boundaries that are needed to visualize your data on the Atlas.
- Click “Join Data” and load your geospatial dataset into GeoJay.
- GeoJay will use its warehouse of States, Counties, Zip codes, and more to join your Table data with geospatial geographies.
Once the joined data is downloaded onto your computer, navigate back to uscovidatlas.org/map to load it into the Atlas.
How to Add Custom Data:
- Use the Map Navigation Panel and click the Add Custom Data icon. You can load GeoJSON data from your computer or use a remotely accessible online data source. Many common data sources, such as Socrata or Data.gov, provide spatial data as GeoJSON that you can use. Specifically, your geospatial data must be in the WGS84 projection (EPSG:4326).
- Choose your link or load in your file. Click "File Link" to link to an online file, or click "File Upload" to use a file on your computer. Your file will not be uploaded to the Atlas servers, and your data will remain private.
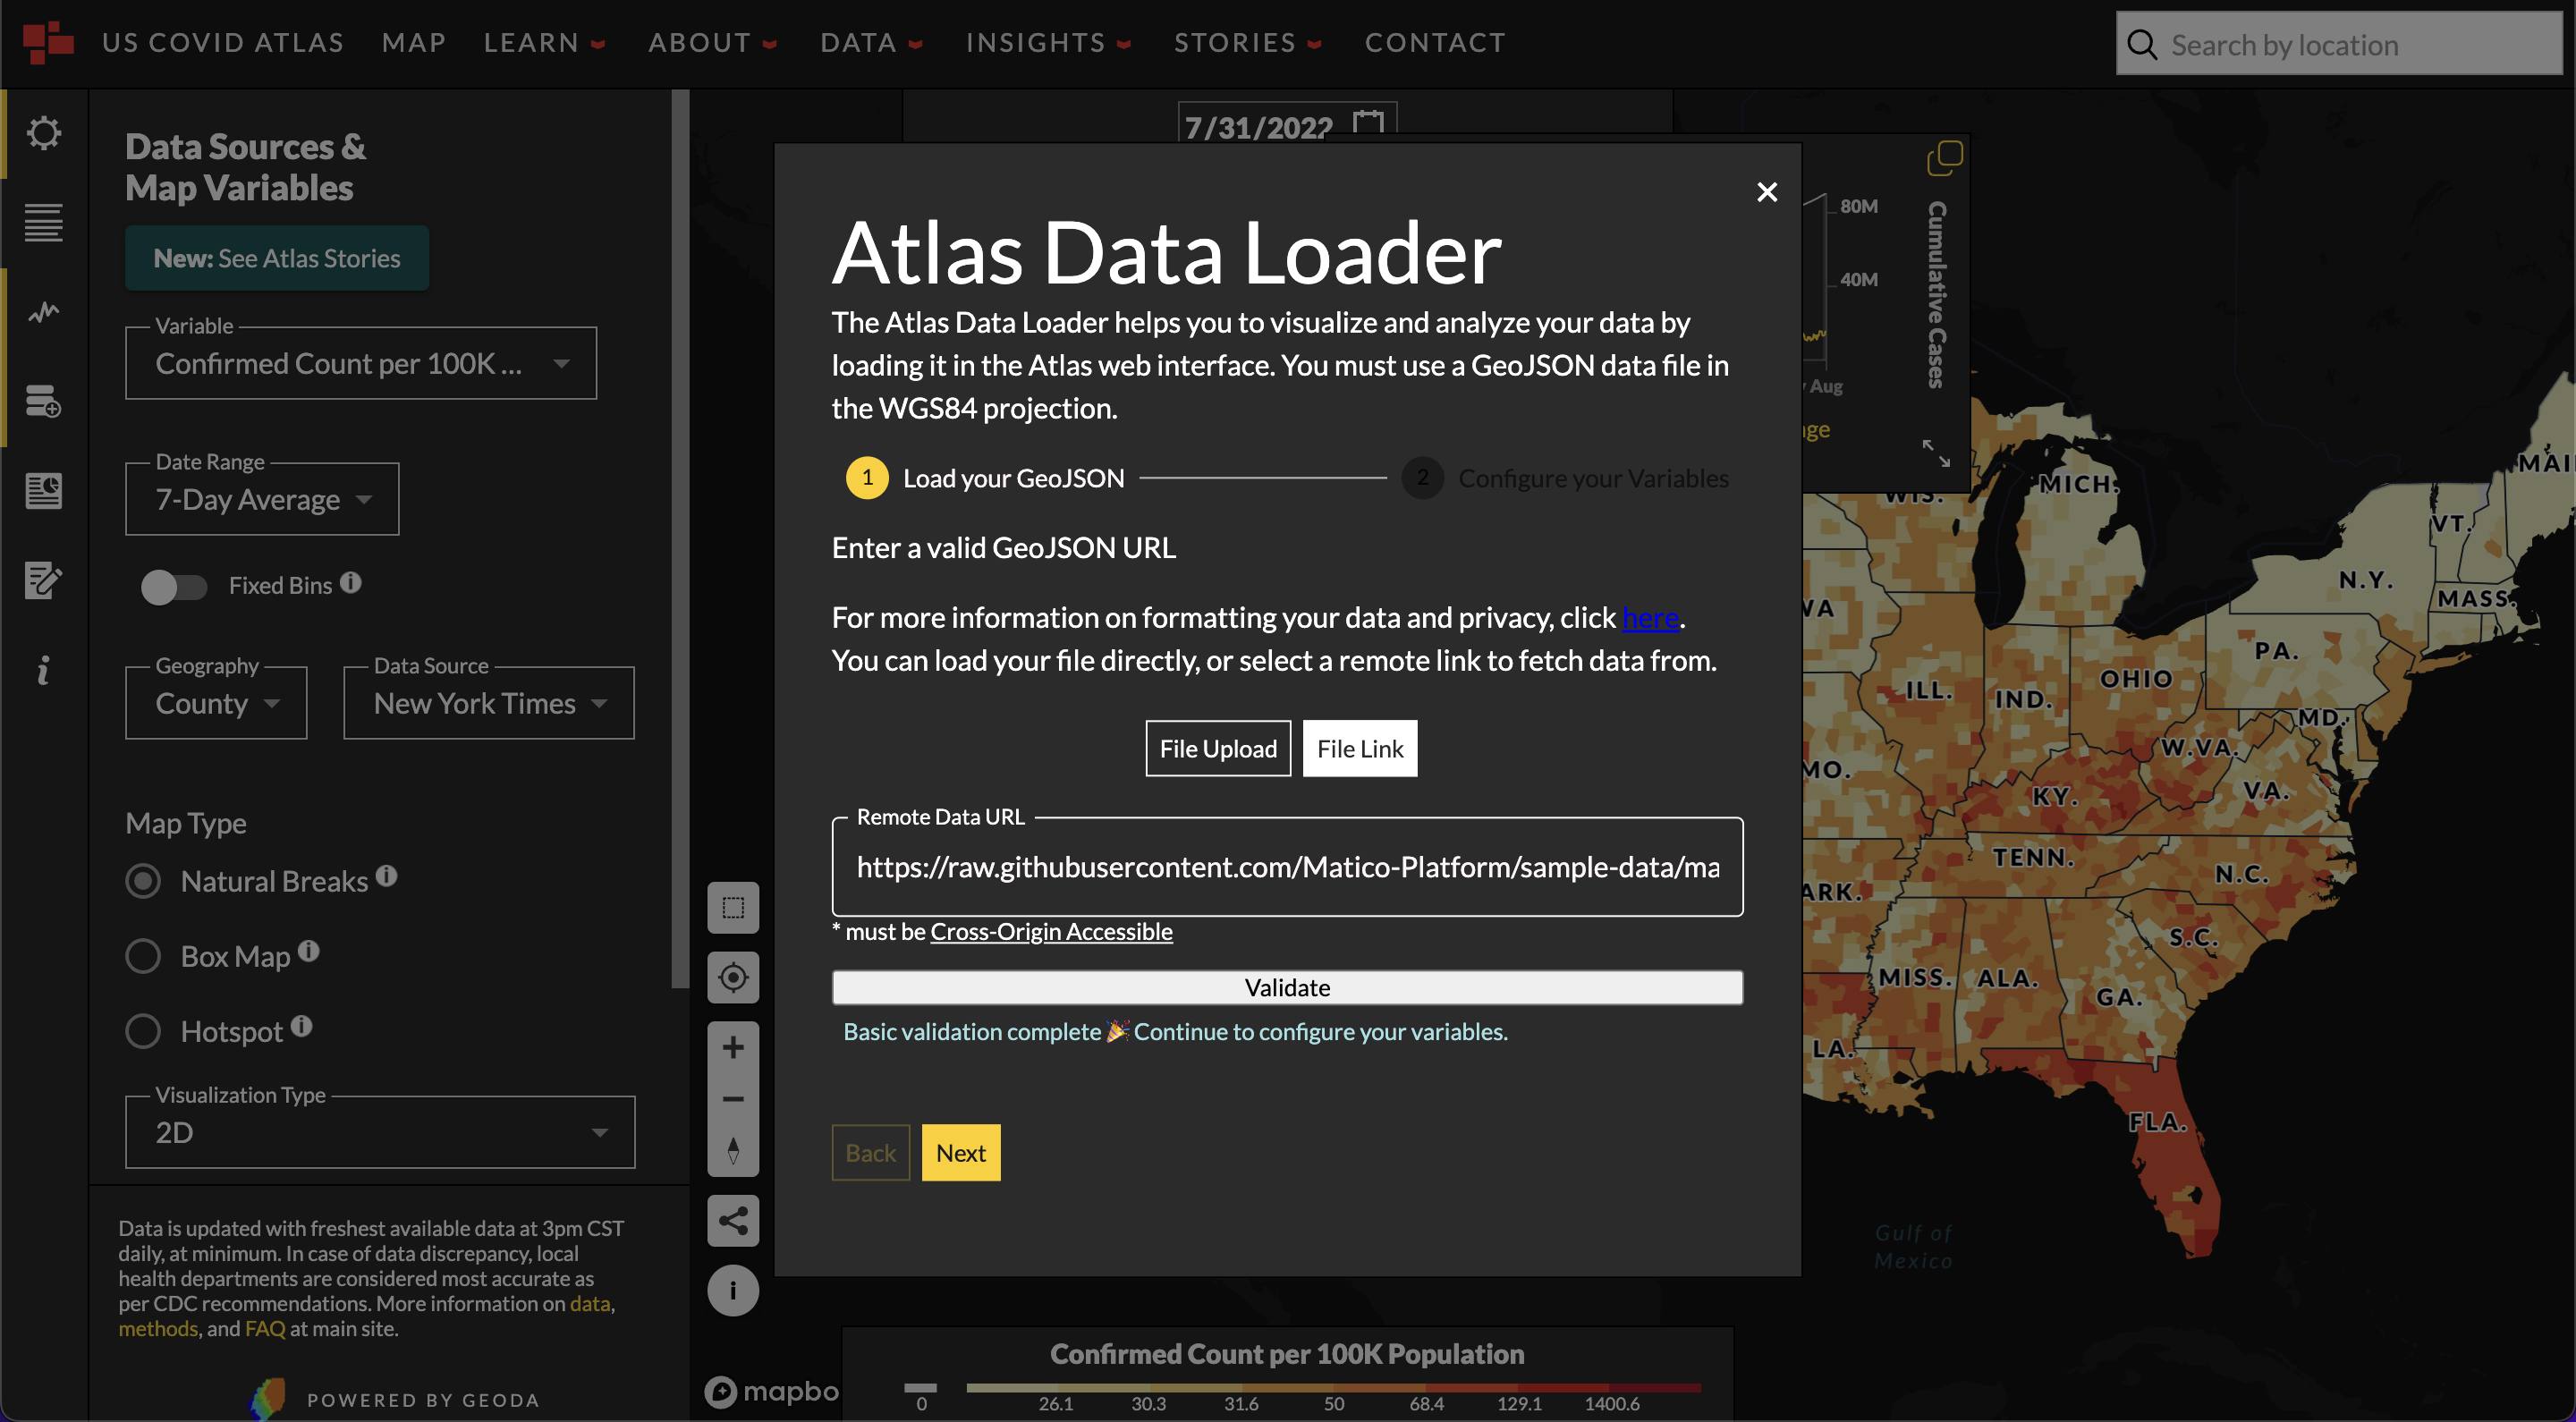
- Validate your data and proceed to the next step.
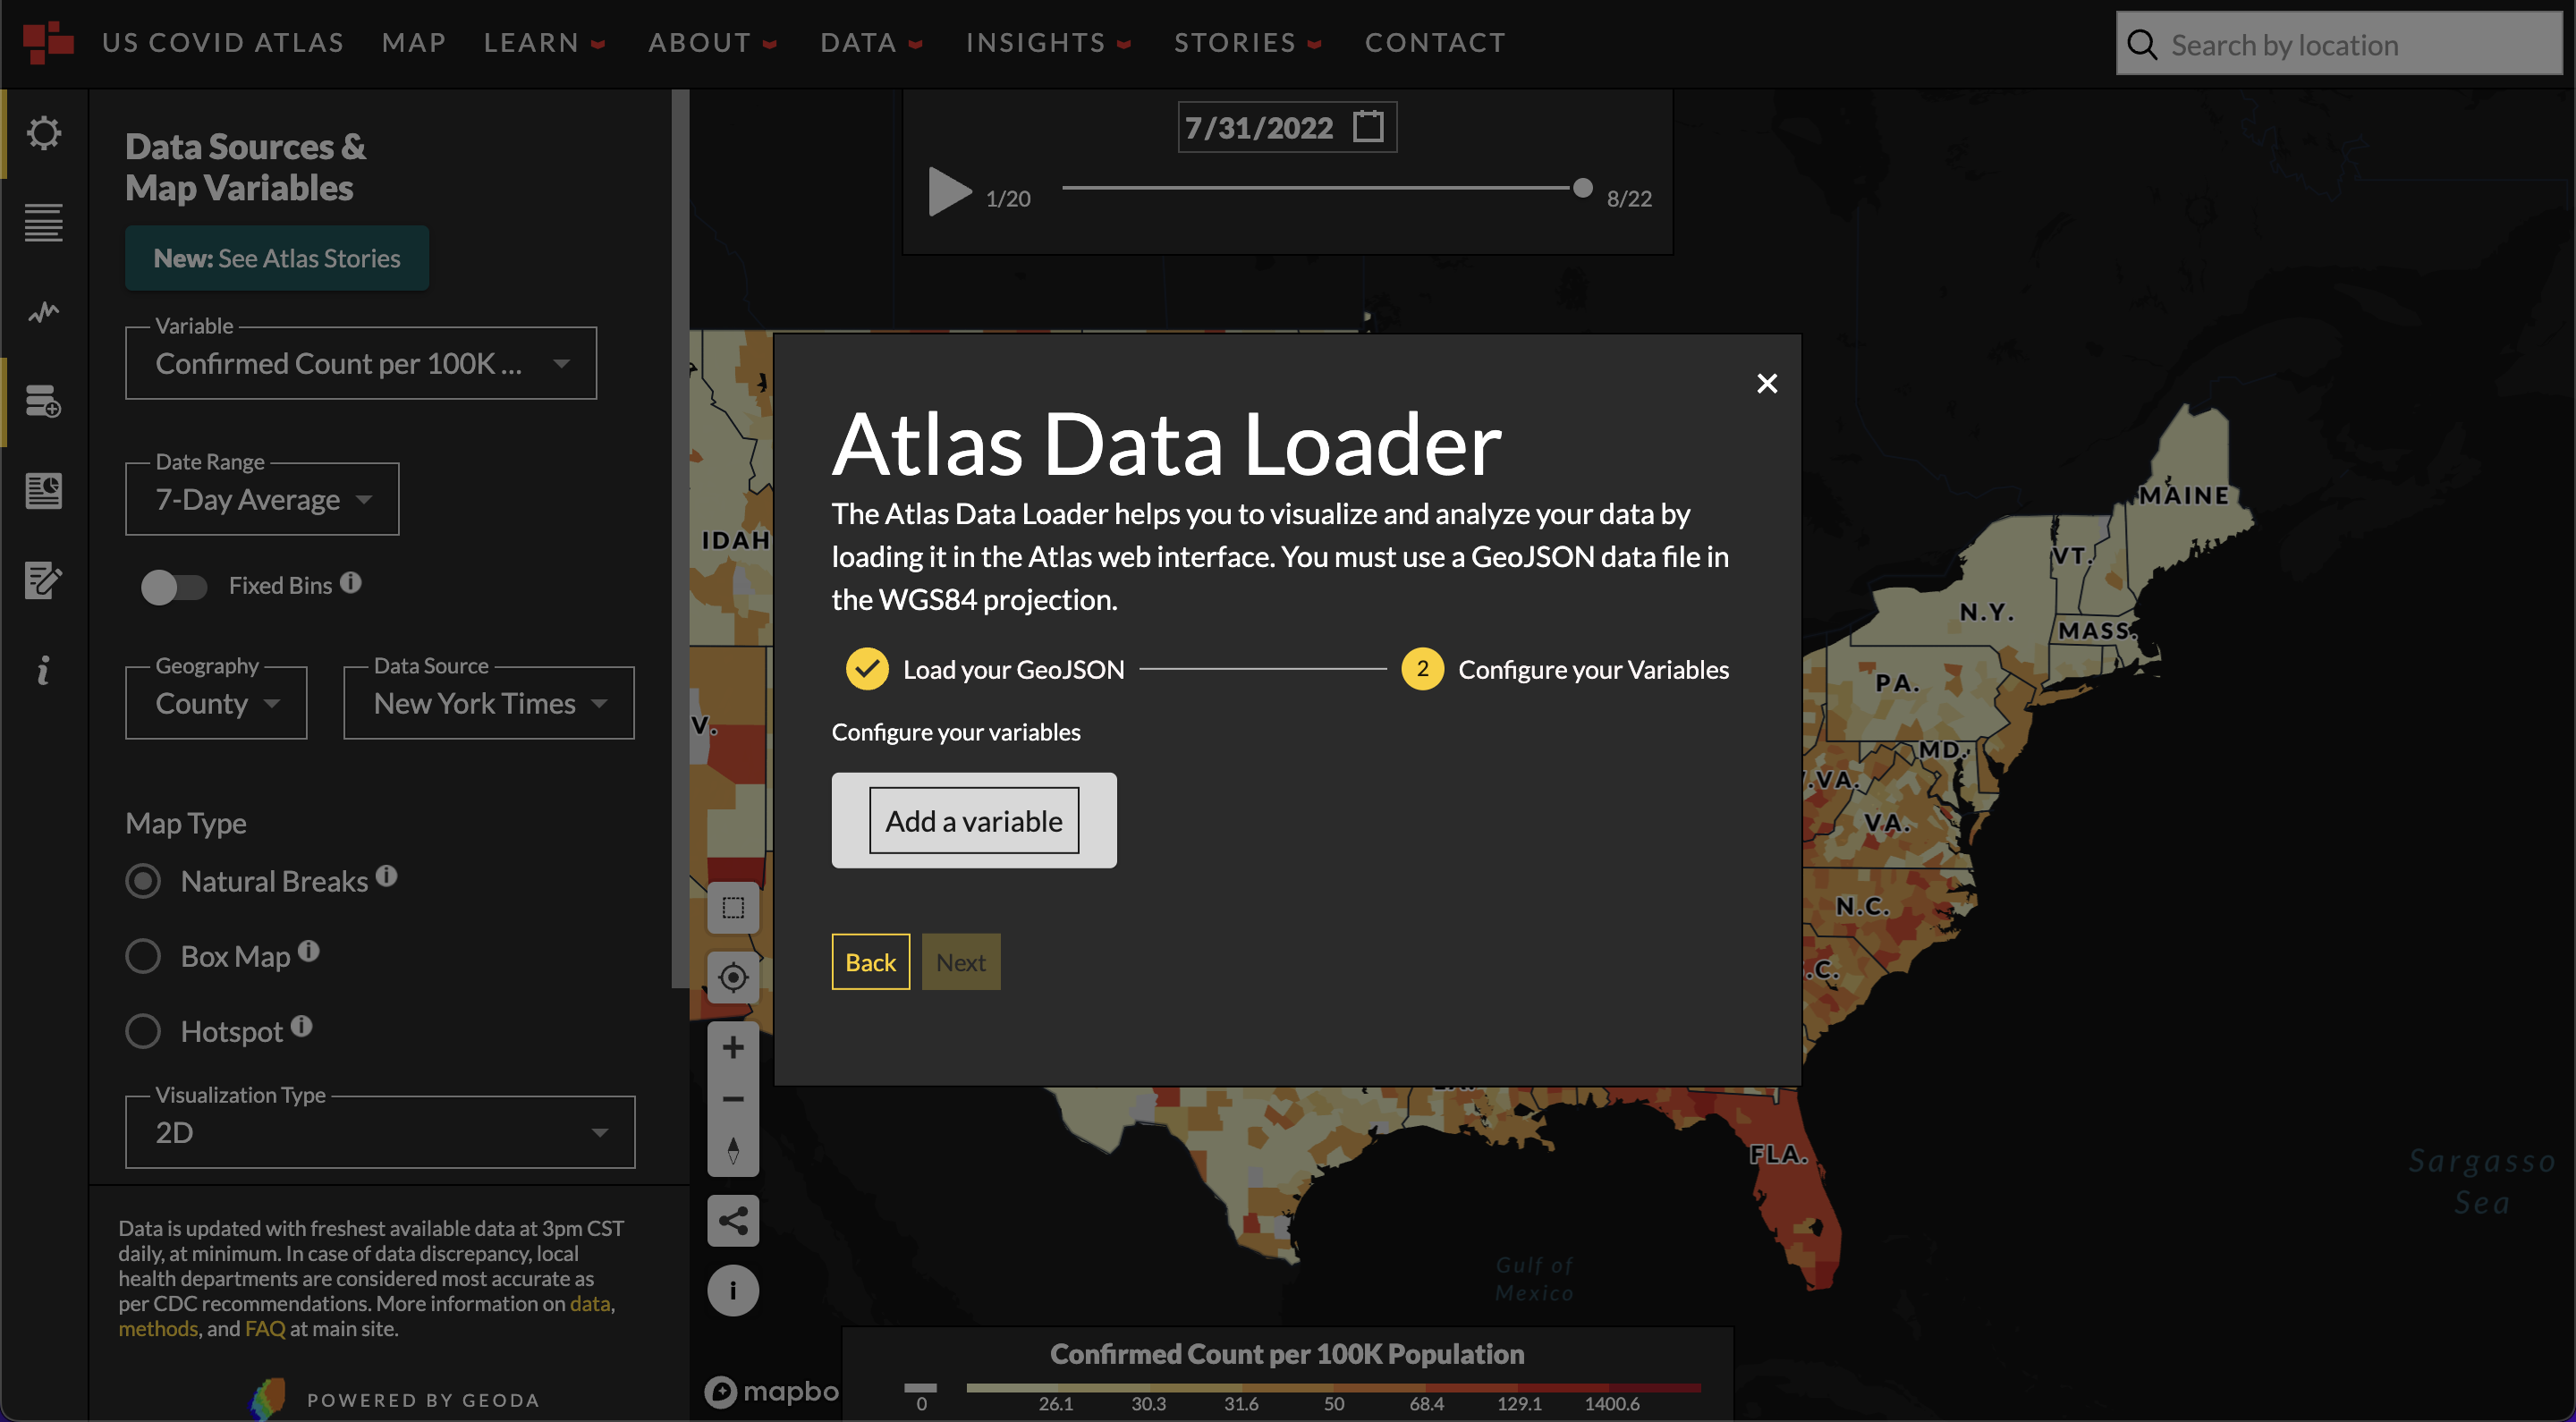
- Add variables by clicking the 'Add a Variable' card. You can add multiple variables from the same dataset.
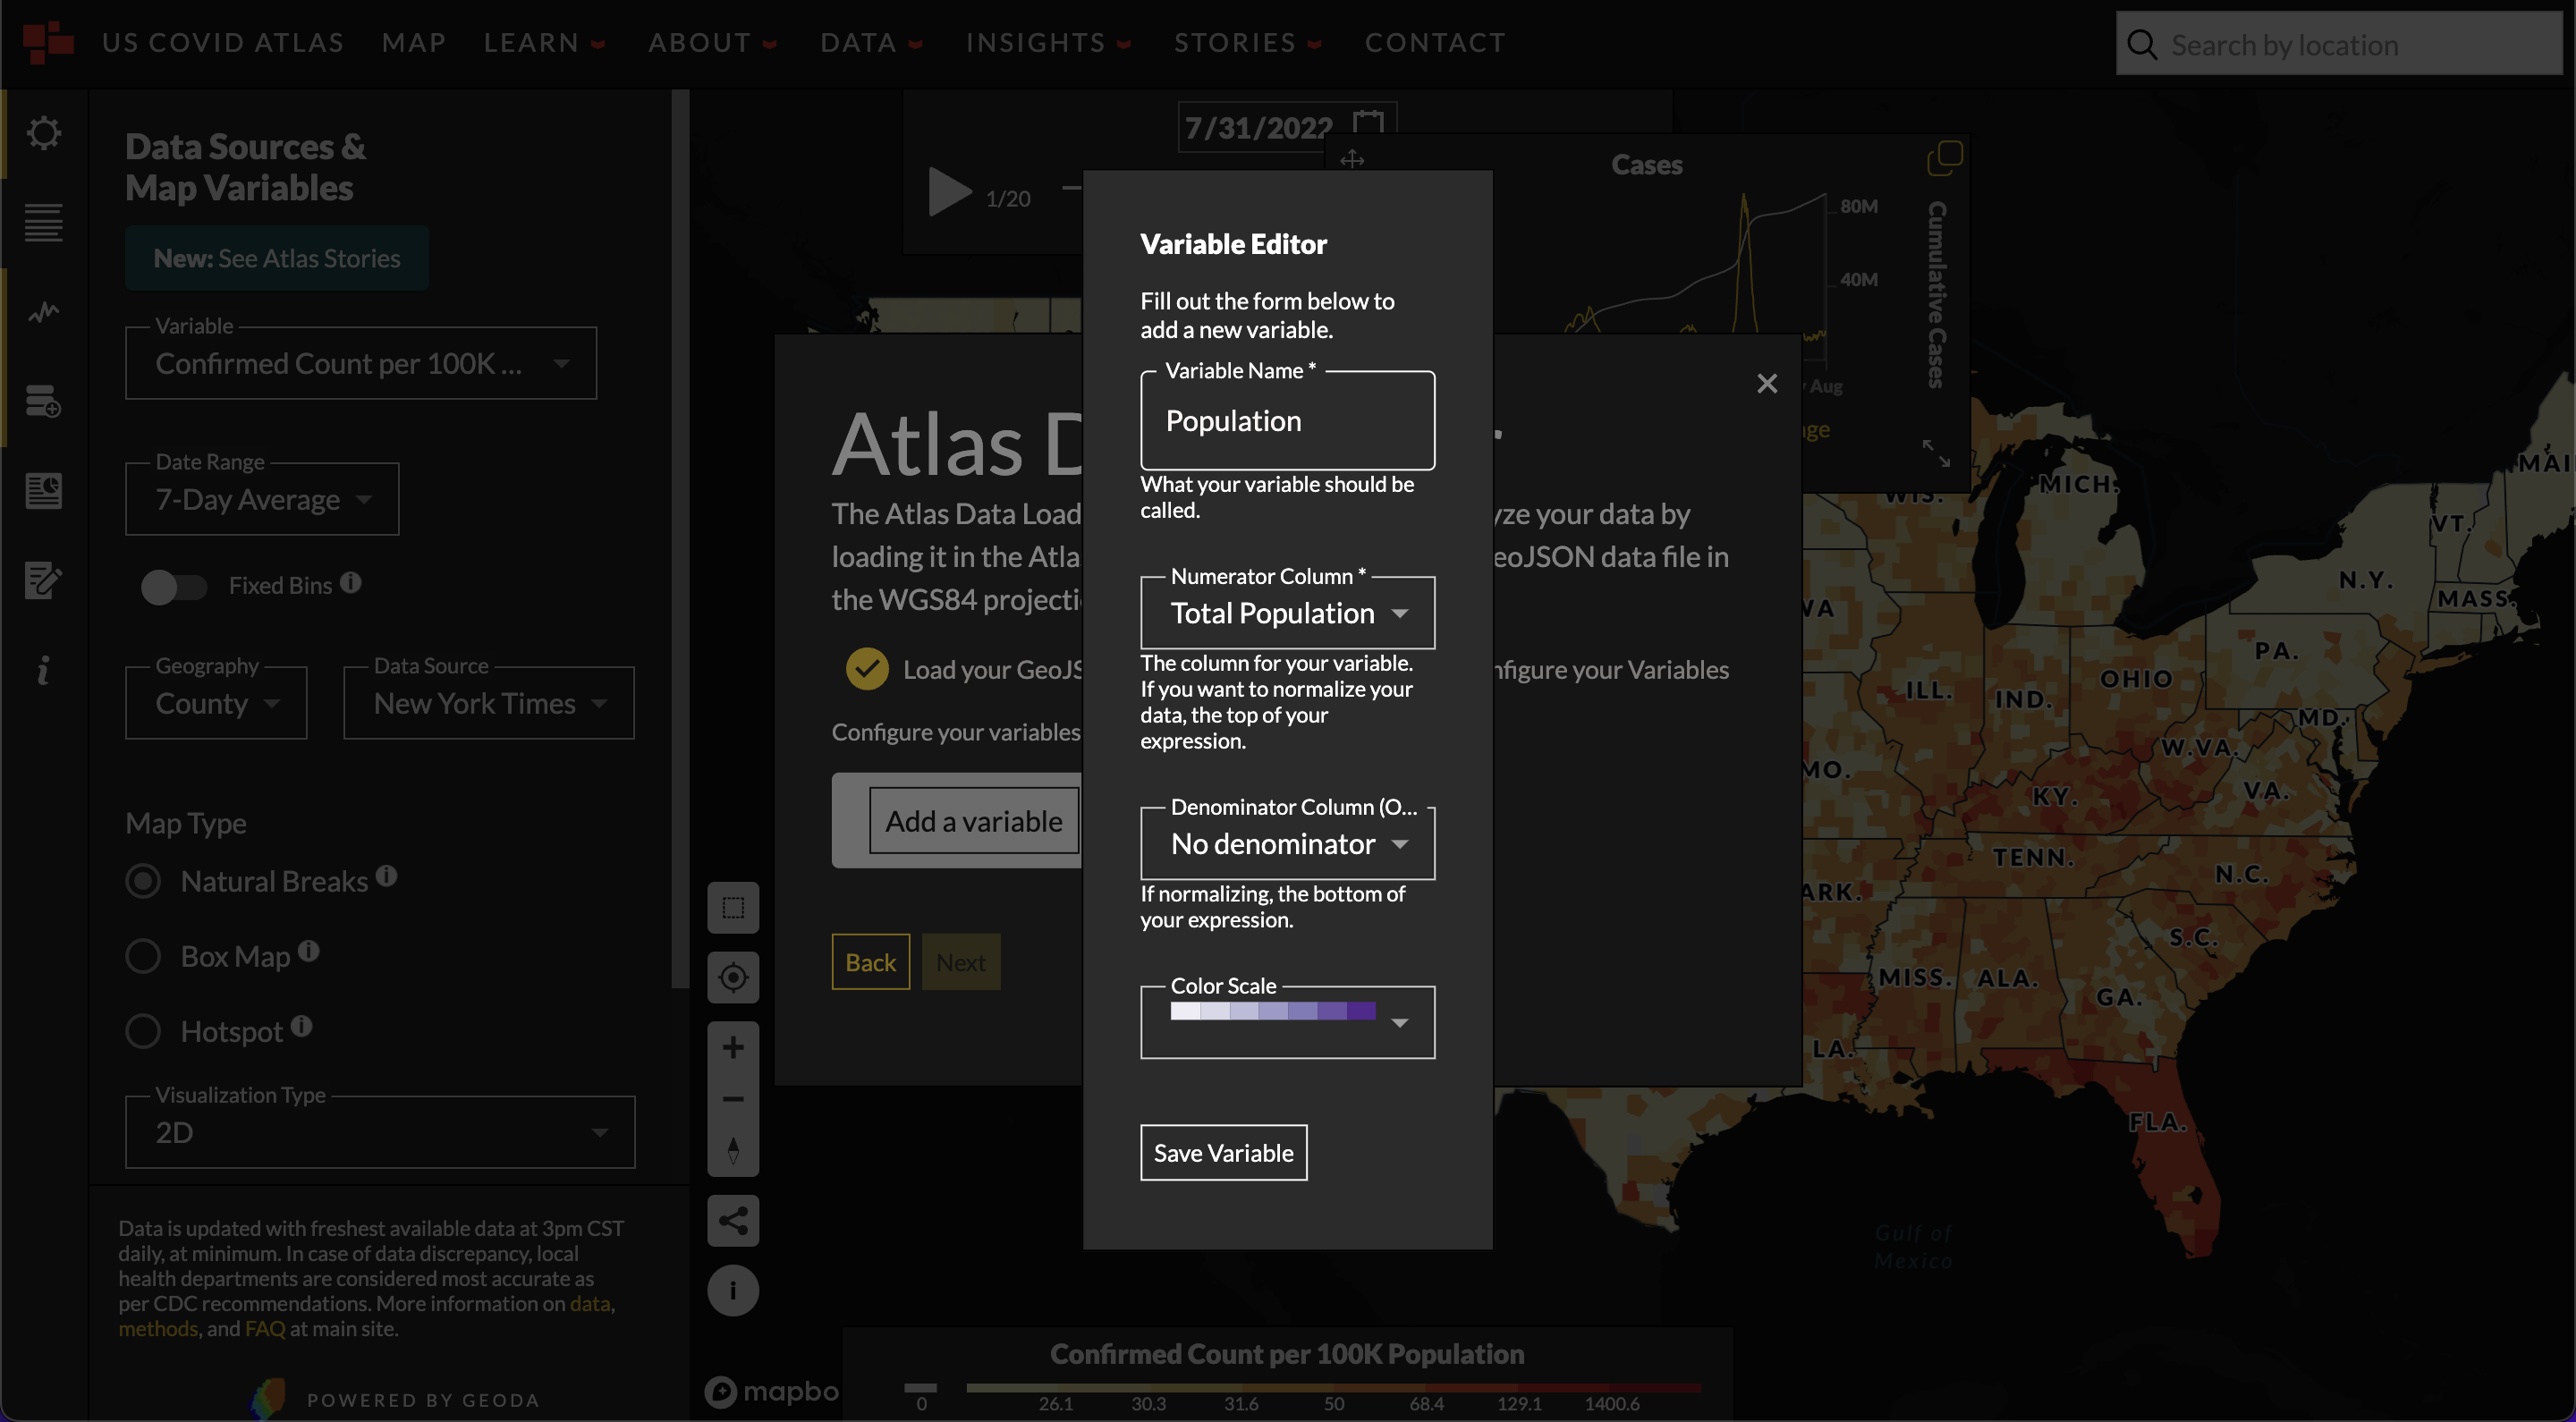
- Using the variable editor, name your variable and choose a data column for your numerator.
You can choose a denominator for your data as well, such as population to normalize your data.
If you just choose a numerator, your data will simply display that data. You can choose a color
scheme to represent your data and click save. You can return to this menu by clicking edit variable.
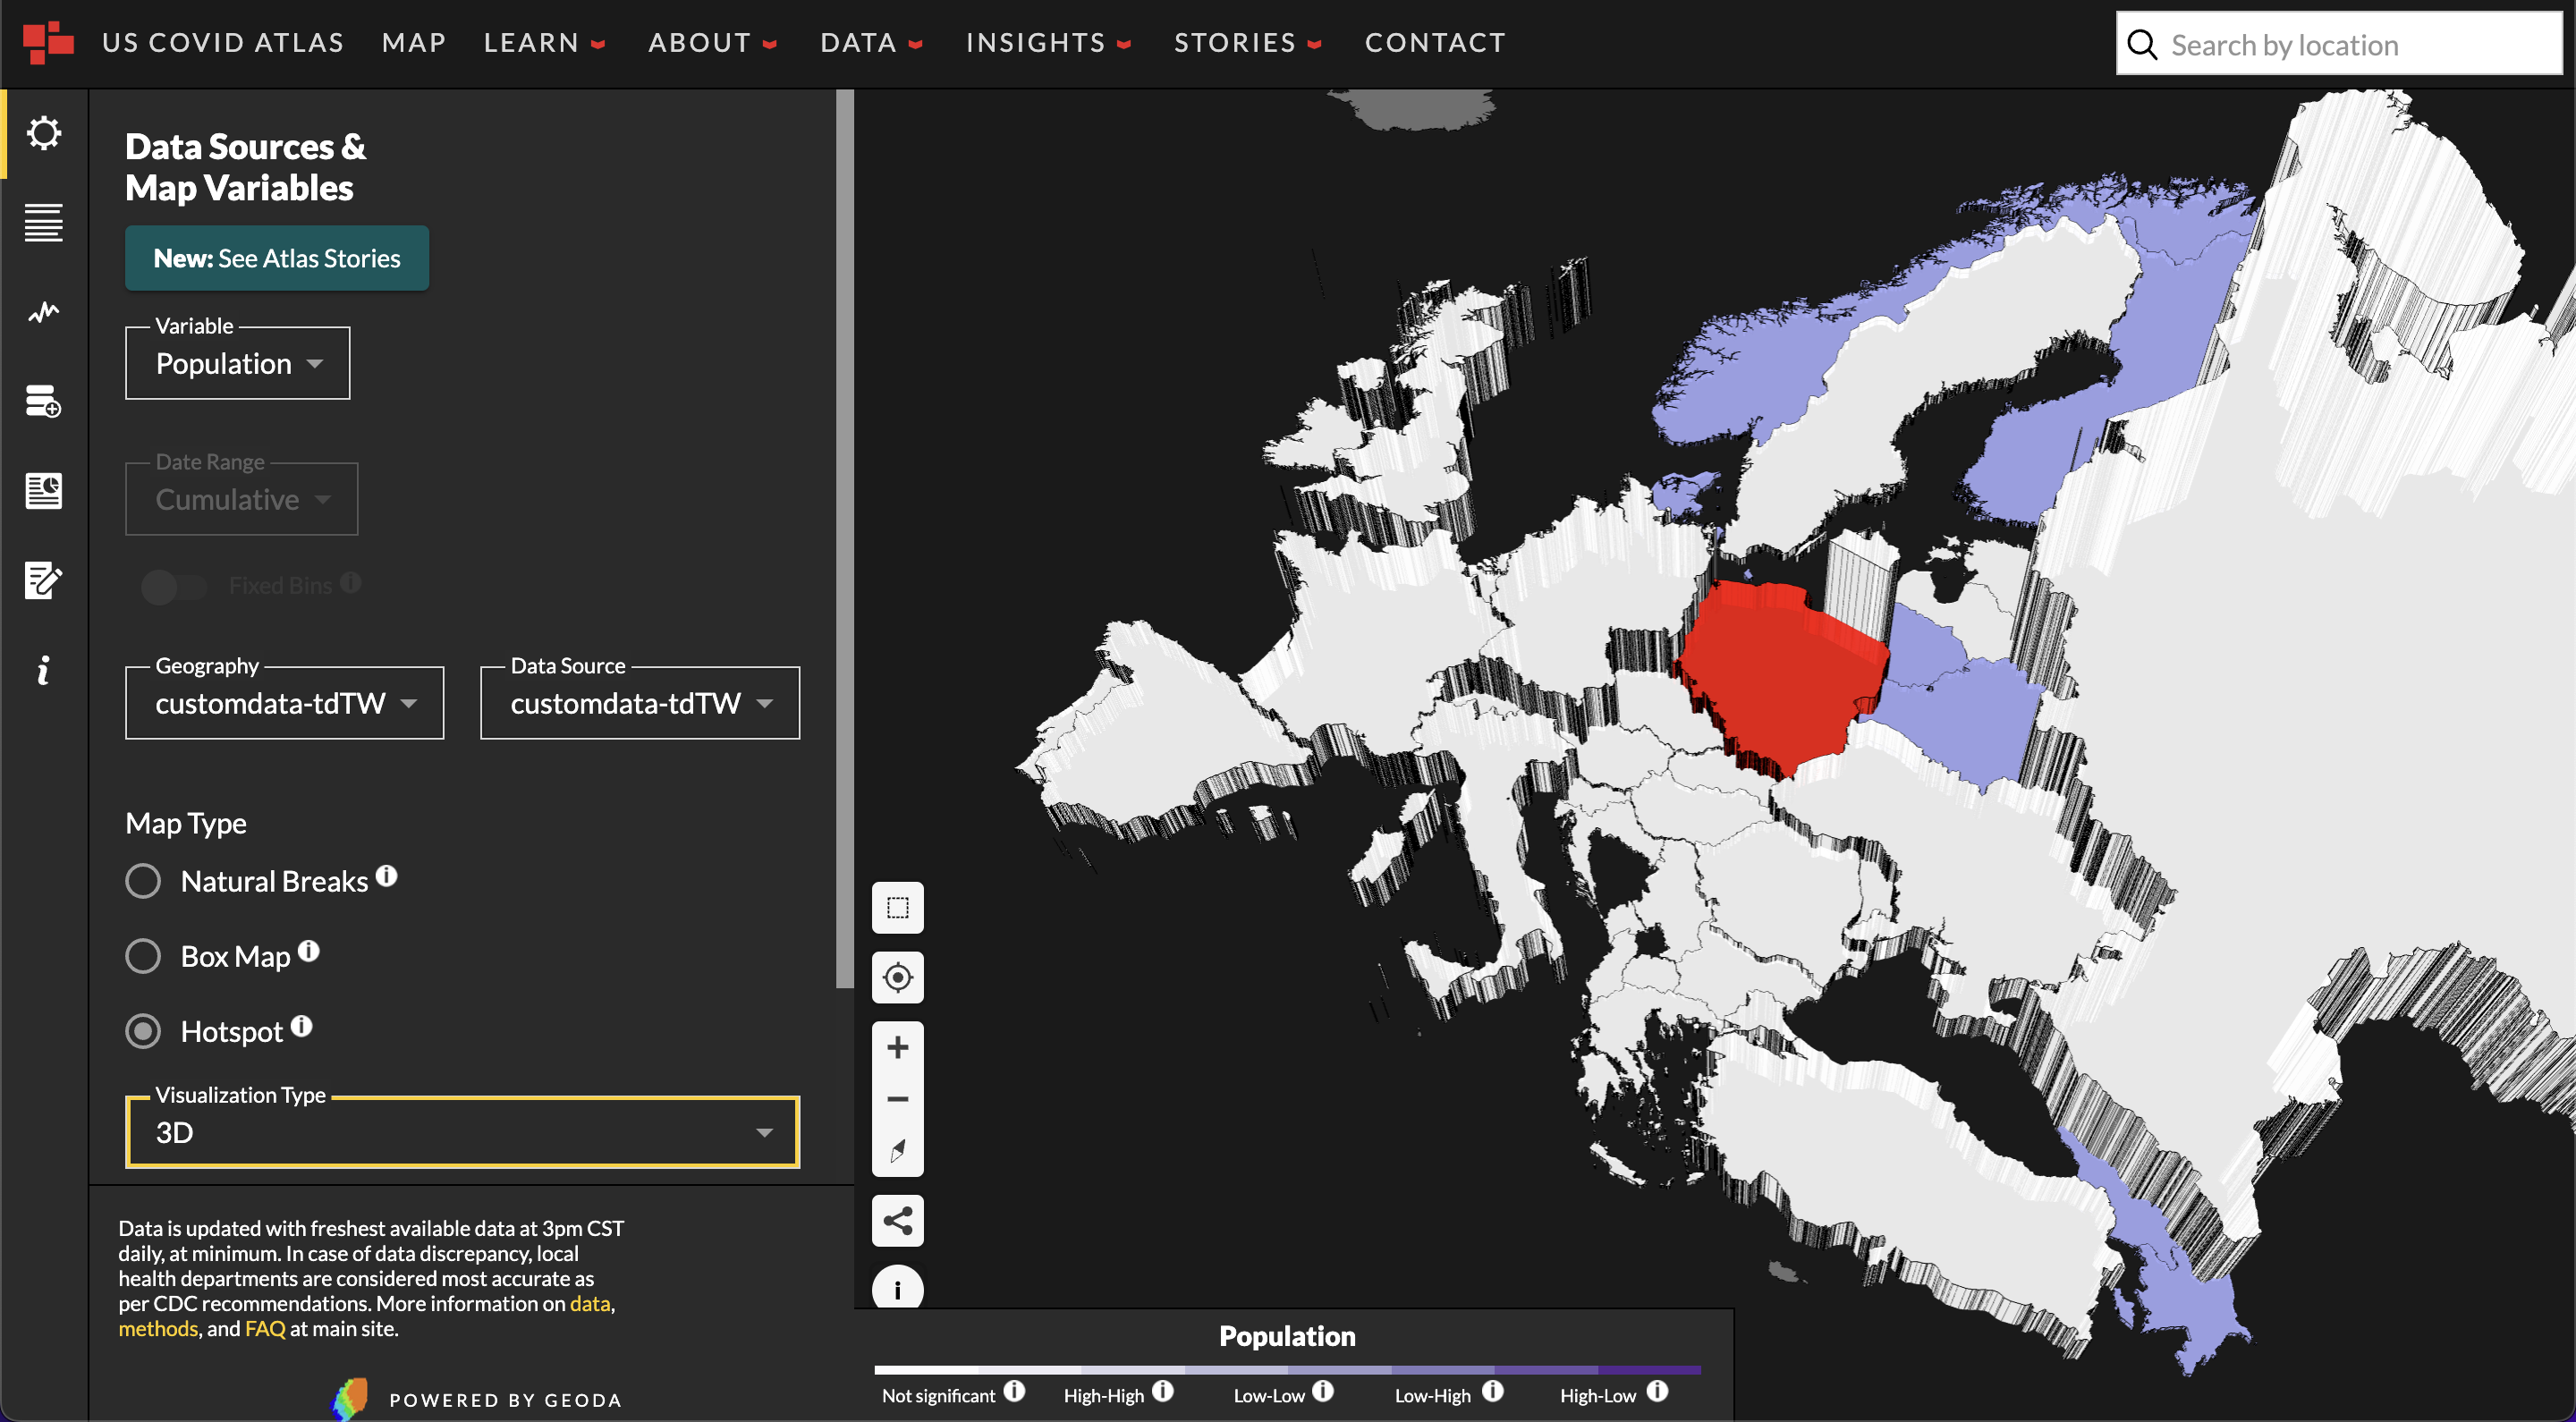
- Once your data is loaded onto the Atlas, you can perform geospatial visualizations with the natural breaks binning, box map binning schemas, hotspot analysis, and any other tools that are available with existing atlas data.
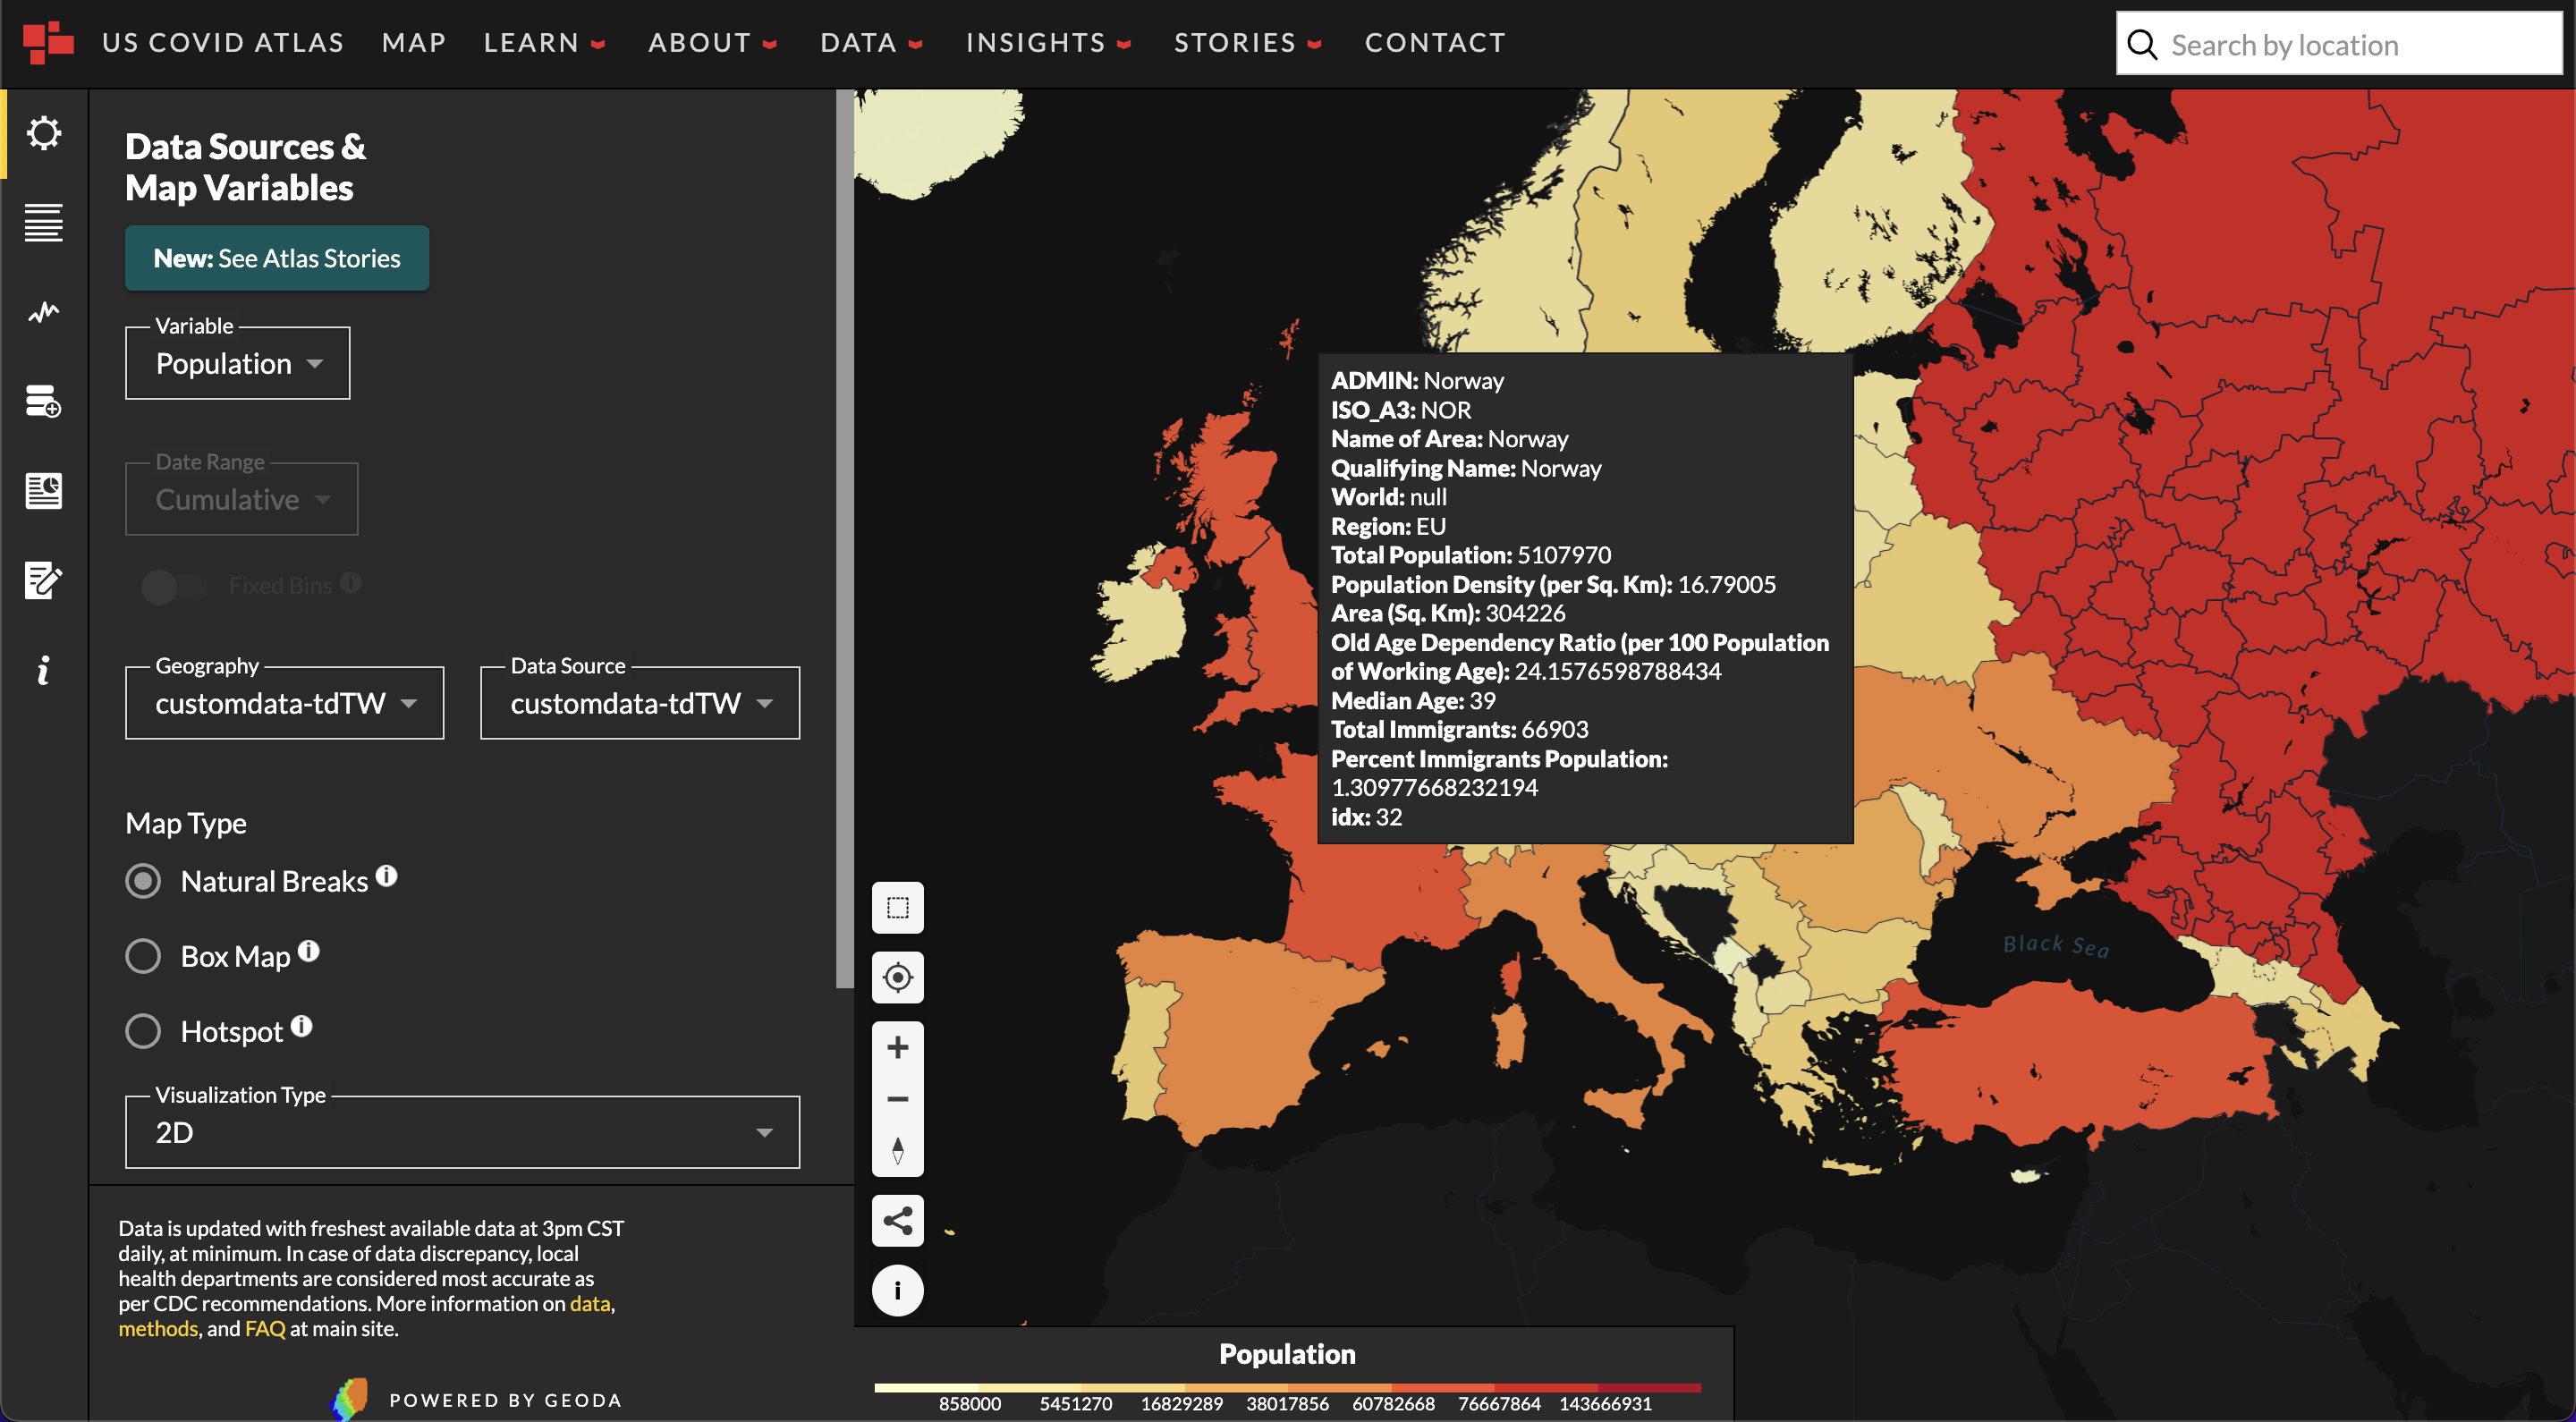
Feel free to even switch back and forth between your custom data and US Covid Atlas preloaded data like county-level case rates, vaccinations, hospitalizations, and use existing tools in the Atlas to get a better understanding of the loaded data.
The Atlas supports polygon geometries and numerical data; weekly rates and other data types may not be read accurately, so be sure to check for areas that have NaN or null values in the Atlas.
The data loaded into the Atlas will not be saved and is just visible to just you – if you would like to save visualizations or analysis loaded onto the Atlas, be sure to check out our tutorial and guides on Customizable Reports!
Make sure your data is in wide format before loading in the Custom Data Loader. What is wide format, and how is it different from long format? In wide formatted data, the county or state’s data will be a single row, and each date or time point (for COVID data shared reported daily, for example) will be in a separate column. By contrast, in the long format, each row is one time point per county or state. So each county will have data in multiple rows. Our set-up requires wide formatted data because it makes reading in the data and any transformations, including visualization, much easier.
If your data is in long format or needs some cleaning up, make sure you give yourself some extra time to wrangle it into wide format.