Sharing Data and Findings
Downloading Data
LOCATION: TOP MAIN MENU: Data > Download
Use the Data Download tool to download bulk CSV files of the data available on the US Covid Atlas.
-
Navigate to the Data Download tool at: uscovidatlas.org/download
-
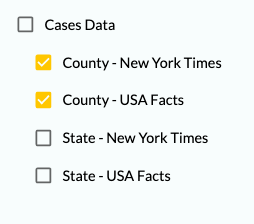
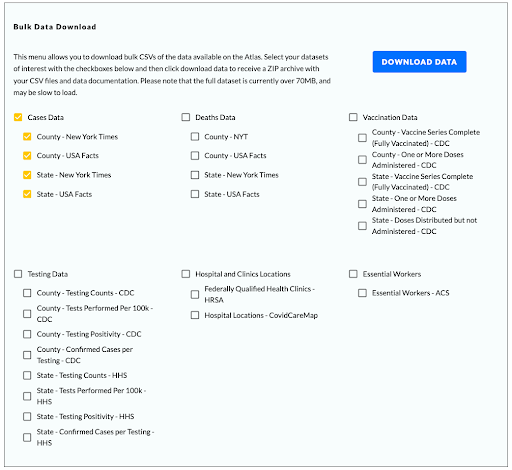
Use the checkboxes to select your datasets of interest. You may choose the full dataset (i.e. all Cases Data), select a dataset by County and/or State, and/or select by Data Source (i.e. Cases Data - County - New York Times and Cases Data - County - USA Facts). See the screenshot below for the complete available data archive.
-
Press the “Download Data” blue button to begin your download.

-
Your device should begin downloading a ZIP archive of your selected CSV files and as well as data documentation. \
-
Unzip the folder to view its contents. You should see 4 items: data folder; docs folder; LICENSE.txt file; and a readme.md file.
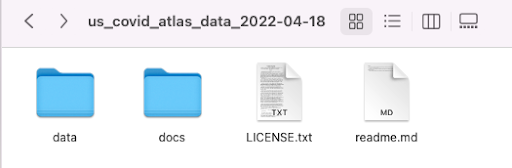
- The data folder contains the CSVs of your selected datasets.
- The docs folder contains the documentation for all Atlas datasets
- LICENSE.txt contains details on the GNU General Public License (GPL 3), a free copyleft license for our open source software and data on the Atlas.
- readme.md contains a brief description of the ZIP archive contents.
If you are downloading the full data archive available on the Atlas, note that the file will be over 70MB and may be slow to load.
Access the Data Download Tool at uscovidatlas.org/download.
Sharing Maps & Findings
Embed a Map View
In a few short steps, you can integrate a map view of the Atlas into your own website to share through embedded content.
Generate the map you'd like to embed with the variables of interest, visualization of county/state level COVID data, and specific community indicators and resources
- Copy the URL link of your generated map by clicking the Share Link Icon on the bottom left of the map
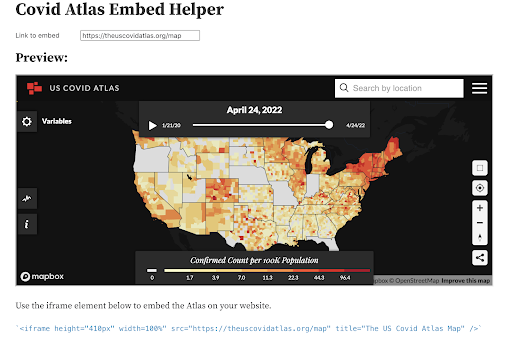
- Navigate to the COVID Atlas Embed Helper
- Copy and paste your unique map view URL link under Link to embed
- (Optional) To change the size of the embedded view, adjust Window Height
- Check the Preview to confirm that you are satisfied with the size and quality of the embedded Atlas map view
- Copy and paste the iframe element located below the Atlas preview to embed the Atlas on your website.
Take a Screenshot
Screenshotting is an easy way to save and share map insights from the Atlas.
- Use the guides in previous chapters of this resource guide to explore and choose your variables of interest, map and visualize county/state level COVID data, and use menu options to view specific community indicators and resources using the Atlas
- Adjust the View window by zooming in and out on your area or insight of interest
- Screenshot the window according to your device’s settings. Visit take-a-screenshot.org for a guide to taking a screenshot on a Windows, Mac, Linux, or Chrome device.