Spatial and Temporal (Time) Scales
You can select different spatial scales (ex. county or state) and temporal scales (ex. daily, weekly, or cumulative COVID-19 cases) in the US Covid Atlas. Selecting different scales will provide different views of the pandemic. We encourage you to explore!
Spatial Scales
LOCATION: LEFT SIDEBAR: Data & Variables
The Atlas allows you to explore data at a county or state-specific level for each variable. To change the spatial scale of your variable of interest, use the Map Variables panel to select the data source and variable that you would like to map, click on Geography, and choose State or County.
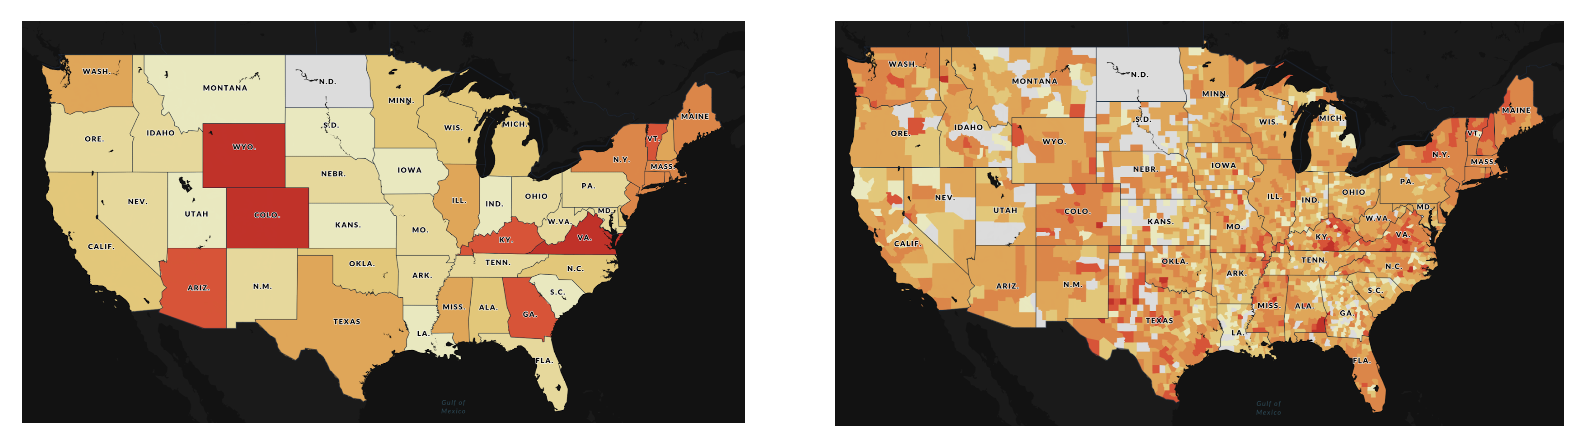
Maps can miscommunicate underlying trends if health data are not appropriately normalized or classified, or communicated at the appropriate temporal or spatial scale (ex. daily versus 7-day average; county versus state level). Spatial literacy skills are crucial to avoid developing maps prone to misinterpretation, as well as avoid misinterpreting maps of Pandemic public health data.
Temporal (Time) Scales
LOCATION: LEFT SIDEBAR: Data & Variables
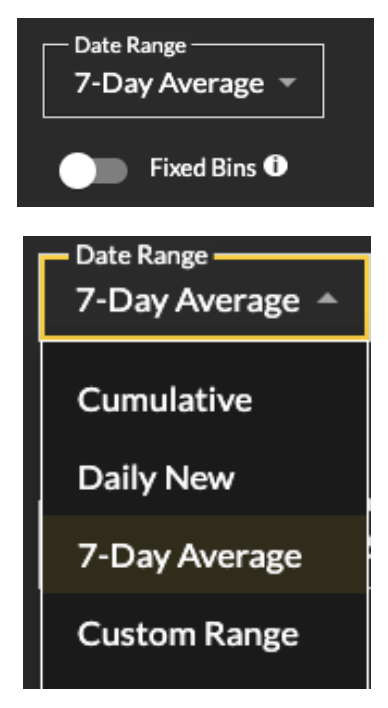
The Atlas offers the option to explore data across various time scales, otherwise known as temporal scales, for each variable. To adjust the scale of data displayed on the Atlas, use the map variables panel (left sidebar) to select the data source/variable that you would like to map and click on the Date Range drop-down menu. Choose between presenting cumulative, 7-day average, or daily new data. Selecting “Custom Range” allows you to incorporate data from a specific window of time that is selected using the Time Slider & Calendar. The following temporal scales are available on the US Covid Atlas:
- Cumulative: Total number of instances, such as confirmed cases, deaths, or vaccines, since the start of the pandemic or the start of data collected.
- Daily New: The number of new instances per day for which data is available.
- 7-Day Average: The average number of instances over the previous 7-day period for which data is available.
- Custom Range: Use the Time Slider and Calendar to choose a custom date range; i.e. the last month, 6 months, the latest variant, etc.
Maps can miscommunicate underlying trends if health data are not appropriately normalized or classified, or communicated at the appropriate temporal or spatial scale (ex. daily versus 7-day average; county versus state level). Spatial literacy skills are crucial to avoid developing maps prone to misinterpretation, as well as avoid misinterpreting maps of Pandemic public health data.
Read more about problems of scale at the GIS&T Book of Knowledge.